
For consumers who have been closely tracking economic and housing trends, the signs suggest the labor market is softening. Job prospects, income stability, and consumer confidence are all important drivers of homebuying decisions. As employment trends shift, they can alter the pace of housing demand across the country.
See related: Health Care Jobs Are Reshaping Local Housing Markets in 2025 – Here’s Where the Impact Is Biggest
Recent anecdotal reports about the challenges facing job seekers are backed by data pointing to a broader labor market slowdown. There were fewer job openings in August 2025 (7.1 million) than the same month in 2024 (7.8 million) and 2023 (8.6 million). Meanwhile, monthly job gains through the first eight months of 2025 averaged nearly half the rate for the same period in 2024. Additionally, the unemployment rate has ticked up to 4.3%.
See related: Regional Housing Market Trends 2025: Why Buying a New Home Is Easier in Some Areas
Understanding Unemployment Data
Unemployment data is particularly nuanced and important in helping gauge labor market conditions, states to watch, and the potential impact on the housing market.
See related: How Immigration Reform Could Reshape the U.S. Housing Market in 2025
The Bureau of Labor Statistics tracks the unemployment rate in six ways.
The most common unemployment metric – denoted as U-3 – tracks the share of the civilian labor force that is unemployed but has actively looked for a job in the past four weeks.
A more comprehensive measure – denoted as U-6 – takes the U-3 rate, adds workers who have not looked for a job over the past four weeks, workers who have looked in the past 12 months but not the past four weeks, and workers that are working part-time for economic reasons.
Generally, the higher the U-6 rate and the wider the gap between the U-3 and U-6 rate, the weaker the overall economy tends to be.
Conversely, a lower U-6 and a narrower U-3/U-6 gap point to stronger economic and housing fundamentals.
NewHomeSource parent company Zonda analyzed the U-6 and U-3/U-6 gap on a national and state-by-state basis to provide indications of where the labor market is more challenged and where it is holding up.
National Unemployment Trends: The national U-6 rate was 8.1% in August, the highest level outside of the pandemic since 2018. The uptick reflects a higher level of part-time employment, which typically occurs during times of slower economic growth.
On a national level, the spread between the U-6 and U-3 rates (3.8%) is relatively consistent with recent years and the 30-year average of 4.5%. This steadiness suggests that the labor market slowdown is broad-based rather than disproportionately driven by discouraged workers or people stuck in part-time jobs.
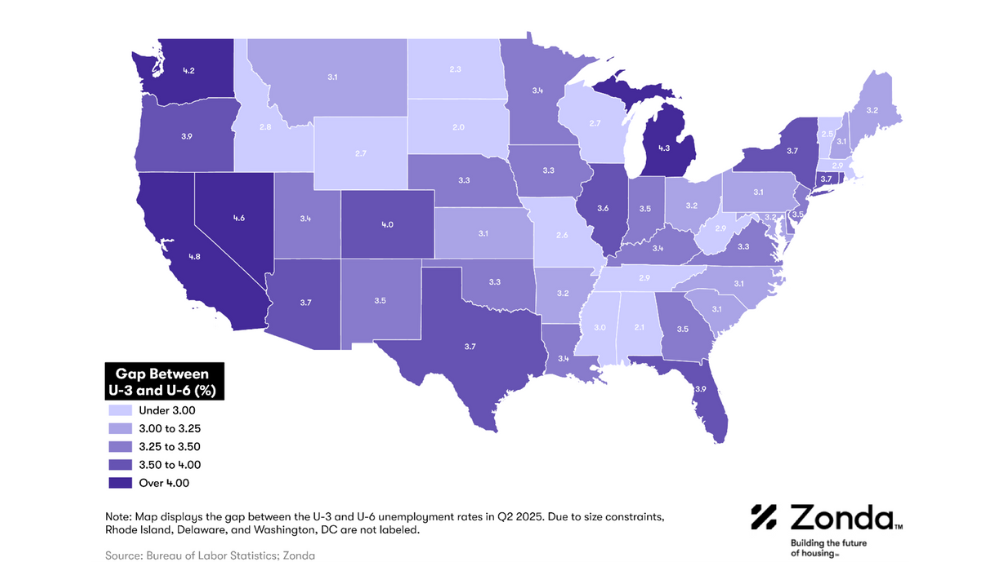
State Unemployment Trends: U-6 unemployment data is published at the state level on a quarterly basis. In the second quarter, 11 states saw their U-6 unemployment rate exceeded the national average: California, Nevada, Michigan, Oregon, Washington, Rhode Island, Alaska, Colorado, New Jersey, Kentucky, and Illinois.
Unemployment Rates and Housing Demand
However, the U-6 rate alone is just a starting point. More meaningful insights come from analyzing the U-3/U-6 gap. At the state level, the gap revealed the following:
California, Nevada, and Michigan led the country. While these states typically have wider gaps because of the prevalence of service, leisure, and hospitality jobs, the current gaps suggest slower housing demand in these markets.
Florida ranked highly despite having one of the lowest U-3 rates. The data suggests Florida’s housing slowdown is less a result of economic pullback and more a result of rising costs, strained affordability, and high housing inventory levels.
Washington and Colorado’s slower housing markets can be tied to employment trends. Both states had unemployment rates and U-3/U-6 gaps higher than the national average.
States with the smallest gaps typically were smaller by population and limited in new construction activity. These states include Missouri, Vermont, North Dakota, Alabama, and South Dakota.
What It Means
Labor market conditions are a key driver of housing activity. When employment is strong, consumers have the financial security and confidence to buy homes. Conversely, when job opportunities dry up or income becomes unstable, buyers pull back, delaying purchases or opting for rentals.
This slowdown in the labor market – marked by fewer job openings, slower job creation, and higher underemployment – suggests we could see continued pressure on housing demand, especially in states with widening labor market challenges.


