The price of eggs may have settled down a little bit, but you’re not alone in noticing that housing is still running hot.
In fact, housing prices have risen 4% over the last year, while other goods and services have increased by 3.7%. Housing inflation jumps to 30.4% if you go back to 2019 – nothing to sneeze at.
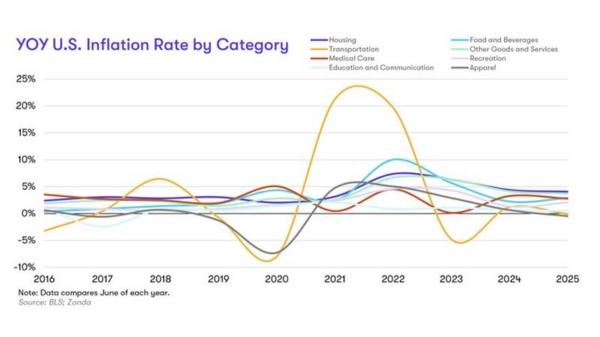
The clear standout category above?
Housing.
Leading in both YOY and cumulative growth since 2019, housing has continued to be a major driver of overall inflation. The graph illustrates that housing plays a disproportionately large role in the national inflation narrative, standing out as one of its most visible and persistent contributors.
When we excluded shelter-related costs from the CPI, 2025’s inflation level dropped to just 1.5%, well below the 2.7% overall figure.
So, where has inflation hit the hardest? This map shows exactly where prices have increased the most since 2019.
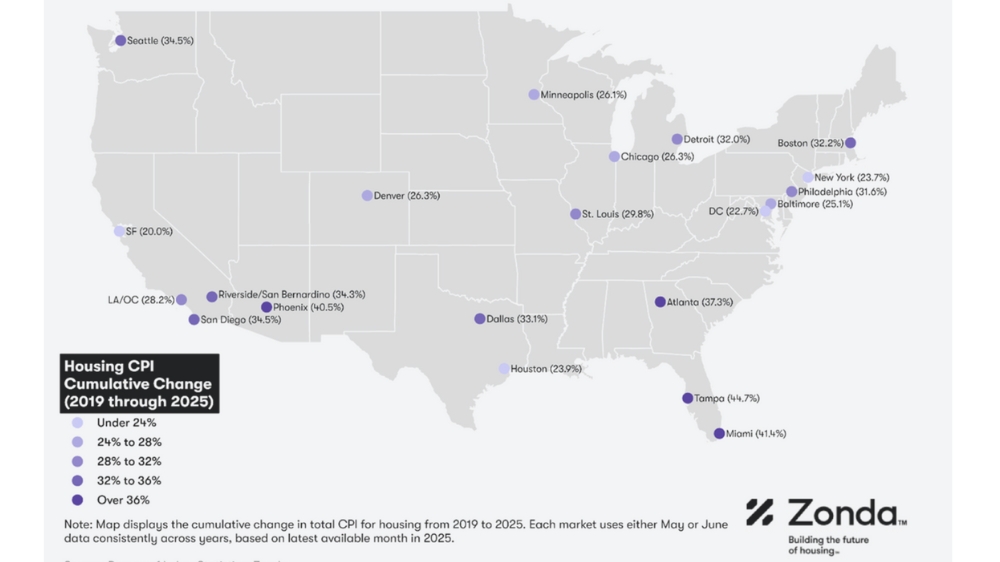
Does that mean these markets will continue to increase disproportionally? Not necessarily, but it provides a great overview of how inflation has impacted housing markets nationwide since 2019.


