
Demographics are perhaps some of the most important indicators for the housing market. An area’s demographics can impact housing demand, where builders operate, what type of housing product is required, and what design elements are most important.
See related: Top U.S. Cities for Job Growth in 2025 – and Why It Matters for Homebuyers
As the U.S. becomes more diverse – with nonwhite populations accounting for a growing share of the nation’s workforce, household formation, and first-time buyers – this shift is likely to affect housing activity.
See related: Why Life Events—Not Mortgage Rates—Will Drive the 2026 Housing Market
To understand how and where these shifts are occurring, NewHomeSource parent company Zonda analyzed Census data* across 49 major markets to identify how demographic composition may align with future homeownership trends.
See related: America’s Next Housing Hot Spots: Smaller Markets with Big Momentum
A good starting point to understand the scale and direction of the demographic shift in the U.S. is the national population picture. In 2023, 39.5% of the national population identified as nonwhite. Ten years ago, this share was 26.3%; 20 years ago, the share was 23.9%.
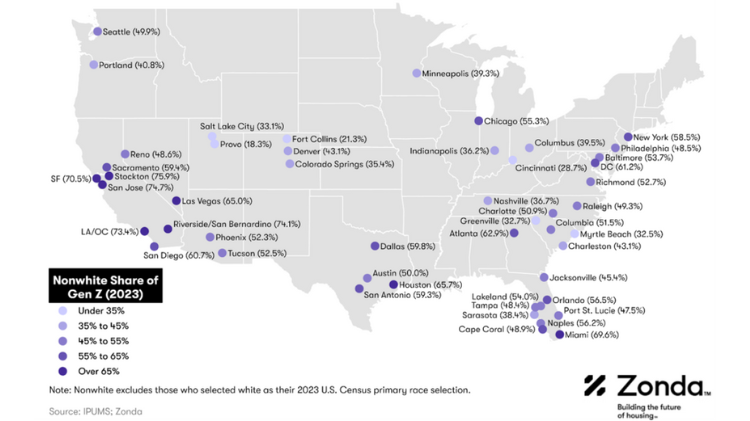
Among the 49 metros analyzed by Zonda, the story is even more pronounced. Nonwhite residents made up 49.8% of all residents in 2023 across these markets, nearly 10% above the national figure. California led the way, with markets including San Jose (70.9%), Stockton (68.8%), Los Angeles/Orange County (67.1%), and Riverside/San Bernardino (68.5%) with shares well above the national share. Conversely, Mountain West metros such as Fort Collins (17.3%), Provo (18.8%), and Denver (34.4%) had shares below the national average.
Generational Distribution
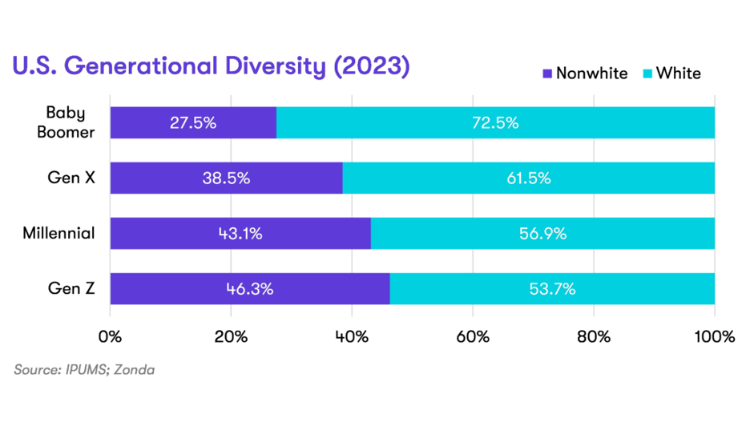
Beyond the population share, the generational makeup of the nonwhite population provides a clearer window into how long-term housing demand may be impacted. Younger age structures among many nonwhite groups mean a larger share of the population are advancing into life stages associated with preparing for homeownership, putting pressure on both the rental and ownership markets over the next decade. Nationally, each younger generation is more diverse than the one before it. In 2023, 27.5% of Baby Boomers identified as nonwhite, compared with 38.5% of Gen X, 43.1% of Millennials, and 46.3% of Gen Z.
The generational progression is also evident across most of the major markets analyzed by Zonda. In nearly every market, diversity increases as generations get younger, suggesting the pool of prospective buyers will not only increase, but become more diverse over time.
Approximately 70% of the top markets had a higher share of nonwhite Gen Z residents than the nation overall, led, again, by the California markets.
Bottom Line
As the nonwhite population grows, particularly among Millennials and Gen Z, their household structures, preferences, and financial footing may impact how builders think about everything from floor plans to community amenities to price points.
The longer-term homeownership picture will be closely tied to the growth and evolution of the nonwhite population and builders are likely to pivot product, pricing, and community planning accordingly to serve the next generation of American households.
*The Zonda analysis focuses on race alone. The nonwhite category includes the following groups: Black or African American, American Indian or Alaska Native, Chinese, Japanese, other Asian or Pacific Islander, other race (NEC), two major races, and three or more major races. Because the U.S. Census classifies Hispanic origin as an ethnicity rather than a race, individuals who selected white as their racial category and Hispanic as their ethnicity are included in the white population rather than the nonwhite population.


